|
|
|
|
|
TutorialContents:
The files used in this tutorial can be downloaded here: tutorial_data.tar.gz (12 KB).
1. Formats and starting SARSESARSE loads fasta, widetext and col files. The col file format is used by the editor to attach various informations to each position of your alignment. The rnadbtools package contains some format converters that you can use to change the format of your data into the col format e.g. from ClustalW: prompt> aln2col alignment.aln > alignment.colYour file is now ready to be loaded in the SARSE program typing SARSE on the command-line: prompt> SARSEYou will now see the editor window and you can use the File/New menu to create a new project. Alternatively, you can start SARSE giving projectname and file name on the command-line: prompt> SARSE --project=HIV1-leader --file=alignment.colYou should see the SARSE editor window looking something like this:
 2. SARSE: Annotation and editingThe pairingmask can either be based on literature, experiment or prediction. In the first two cases you have to enter the known pairingmask, in the latter case you can make the Pfold program determine a common pairingmask for your alignment (go to the Pfold section). The RNA sequence that you have information about from the literature or from experiments will be referred to here as the reference sequence. Select the positions in the reference sequence that are known to be paired, then click Pair columns . You will be asked which symbol to use in the pairingmask. Write a symbol (will only accept symbols A-Z, a-z and 0-9), click ok, and the program will now write your symbol in the pairingmask and set all bases in the selected columns that can pair to upper case. SARSE uses upper case and lower case to indicate paired and single stranded bases, respectively. You can also change symbols directly in the pairingmask by Change symbol and then use Fit alignment to pairingmask to change the annotation of the sequences below. SARSE contains several features that make it easier to edit a large RNA structural alignment. You use the left mouse button for the basic selection of bases. There are two ways of moving bases within an alignment: (1) You make a selection with the left mouse button and use the right mouse button to drag the selected bases to a new position. The selected block can only be moved in gap regions:
 3. RNAdbtools: RNA database toolsRNA database tools is a collection of programs that is used to maintain RNA structural databases like the tmRDB and the SRPDB (Andersen et al., 2006). These tools are described and documented on the rnadbtools homepage. A list of all the programs can be found here . These tools form the core of the SARSE editor since they allow the alignment to be manipulated in different ways. To use the RNAdbtools select Tools/Programs and the Programs window shows up and in the left panel you can select the rnadbtools programs package. On the right the programs show up with a description: unknown, shiftchk, stdpair, support and extendstem. stdpair tells you if mispairs exist in the alignment. unknown detects unknown bases in the alignment, which can make you consider deleting this sequence from your alignment. The rnadbtool shiftchk is useful when the base pairing of the pairingmask and the individual RNA sequences does not match. This type of problem can however be circumvented by using Fit alignment to pairingmask. Extendstem will suggest extentions at the edges of the stems of individual sequences and of convincing these can be changed in the pairingmask by Pair columns. 4. Pfold: Phylogenetic RNA foldingThe Pfold algorithm will predict a common secondary structure for your alignment. To run the program, select the menu Tools/Programs. When the Programs window appear then select Pfold/pfold.pipe and click ok. This default analysis will run several programs: a phylogenetic tree is estimated, the structure predicted, the alignment is color shaded by the rnadbtool reliability_shade, plots are made, an alpha numerical pairingmask is added, alistem_plot is run, and the alignment is loaded back into SARSE. When the analysis is finished a box appears that asks you if you want to load the resulting file. Click ok. The resulting alignment looks like this:
 You see the common pairingmask at the top and the individual structures below. Pfold assigns a reliability score to each position of the common pairingmask which is plotted onto the alignment using the following color scale: 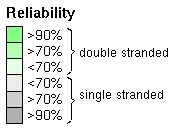 Lets take a look at the additional output that you get from the default Pfold analysis, that is placed in your projects folder. The alistem_plot.png file is a plot with an alignment representation, and below with an additional plot of the basespair correlations shown below the alignment plot: 
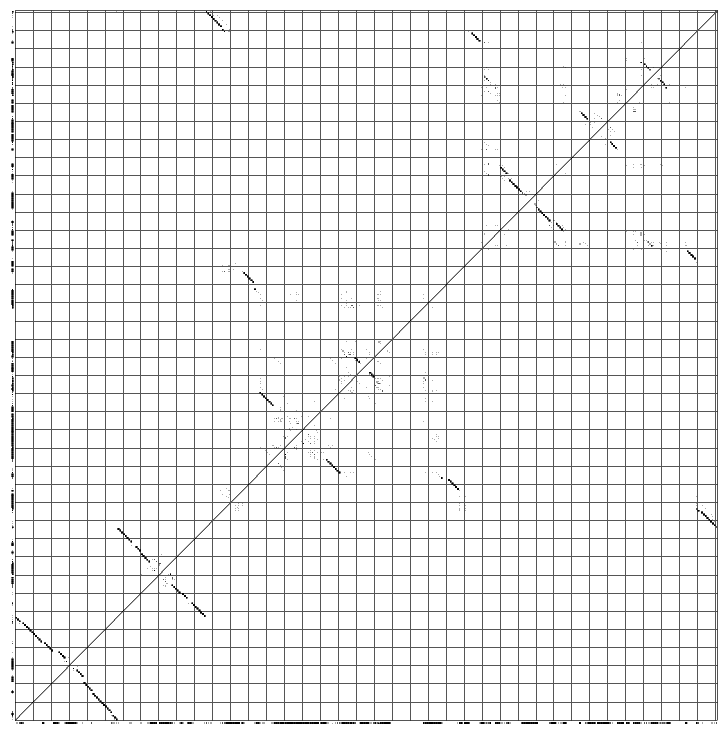
The phylogeny.ps shows you the phylogenetic tree that Pfold used to determine the common secondary structure. The optimal input for a phylogenetic prediction should be a representative set of sequences: 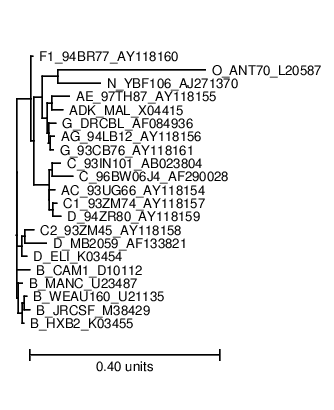 The dotplot.ps shows you the dotplot of the prediction:
A nice way to look at a pfold prediction is to see which types of base changes that made pfold predict the structure. You can use the rnadbtool stem_variation to color the coordinated base changes red, the semi-conserved base changes orange and the mismatched base changes blue. The program is very simple and takes the first sequence as the reference sequence and colors the other sequences by comparison with the reference sequence.
 5. Pcluster: Clustering of Pfold predictionsThe Pcluster algorithm uses an iterative procedure to find the best clustering of sequences based on their Pfold predictions. This is a very handy tool that can both be used to detect alignment errors since it will out-group the misaligned sequences. Typically you want to focus on one or a few RNA structural elements since the calculation time is high. Load the file mir-399.col from the tutorial_data in SARSE. Use Tools/Programs and choose Pcluster/pcluster.pipe analysis. The analysis will take some time (have patience). The pcluster.pipe both clusters the sequences and processes the result file A result directory is created containing clustering details and a result file is loaded back in SARSE. The editor now looks like this:
The subgroups are given different colors like it was seen in the Pcluster tutorial, but in this case the Rfam pairingmask SS_cons is also there. The SS_cons is used as the reference to compare with the SS annotation of the subgroups. The consistency_color program compares the Rfam secondary structure annotation (SS_cons) to the predicted subgroups. Activate it under Tools/Programs coloring/consistency_colors and you get the following editor window:
The alignment is colored as follows: The SS_cons has strong green color if all predicted subgroups are consistent with this position. SS_cons has strong red color if any base pair of the subgroups disagree at this position. The colors correspond to the structure scores (Sin, Sco, Sno) which can be found in the header of the result file, that looks like this: ; Comparison of the structure assignment of Pcluster to Rfam gives: ; S(total) = 726.677 ; S(consistent) = 0 ; S(inconsistent) = 605.4054 ; S(additional) = 121.2716 The Sin score of 25 corresponds to 25 reliabile base positions of the alignment are inconsistent. Sco score tells how much is consistent with Rfam, and Sno score shows how much structure is nonoverlapping. The Sno score is quite high for the mir-399 showing that there are stable structure outside the miRNA helix. Now open the Overview window which looks like this:
The colors helps you to spot a red area in the alignment that contains a misalignment. Click the red area in the Overview window and the editor window will move to the corresponding position. Note the region that is misaligned (positions 10-30 and 125-145). Now we want to Pcluster just this area of the alignment. Choose the Tools/Programs and select Pcluster/pcluster.pipe. Now click the Options button next to the pcluster.pipe and you should see the following regions option:
Now set the region of analysis to 10-30,125-145, and click ok to start the clustering. The result of the analysis is shown here in the Overview window:
It is easy to see by the coloring that only the specified regions were analysed for structure. Now choose split view and click on the red area either in the Overview window or in the editor window. You now see both sides of the misalignment in the editor window. To align the red nucleotides we need some space to move them. Choose the Tools/ Add Column and add a column at position 17. Select the red bases with the mouse and drag them to the right with the right mouse button down. Now choose Tools/Programs and coloring/consistency_color. You now obtain the following overview:
The red bases are gone because of your alignment editing. The alignment can be reevaluated by Pcluster to see if other inconsistencies have been overlooked. Choose Tools/Programs and Pcluster/pcluster.pipe (make sure the region option is deselected, a bug). The result file is loaded and no inconsistent bases are observed. Comparing the clustering curve for the original alignment versus the edited alignment (alignment_groups.dat files) we see that the score for the ungrouped alignment has increased, Sto = 52.6. ; Comparison of the structure assignment of Pcluster to Rfam gives: ; S(total) = 723.4708 ; S(consistent) = 596.4046 ; S(inconsistent) = 0 ; S(additional) = 127.0662We conclude that there are more structural support within the alignment giving rise to increased Sto score. This procedure of Pcluster detection and SARSE editing of alignment inconsistencies should be of general use. Now try for youself on the example alignments in the example_data directory (Telomerase-vert.col, tmRNA.col and SRPDB.col). Be aware that these alignments are much bigger and thus the clustering procedure is much slower. 6. FoldalignM: Folding and aligningFoldalignM makes multiple alignment from unaligned sequenceses. It is use by loading an group of unaligned sequences. Create a new project using the tRNA.fa file from the tutorial-data folder that came with SARSE.
 7. Add your own programs to SARSE
In the package we have included a small script called id_shade,
and here we show what to do to include it.
The program is already in the path, so you should only concentrate
on modifying the xml-file.
<program name="id_shade" priority="7" package="coloring tools"
selected="false" sequencetype="RNA">
</program>
The pogram-name is id_shade and you call it exactly that. We decide to include it in the coloring tools packaqe and set the priority to 7, and it should not be selected by default. The sequencetype attribute is always RNA. The program description is a short one, and the in- and output formats are always col-formats so you add: <program name="id_shade" priority="7" package="coloring tools" selected="false" sequencetype="RNA"> <programdescription> The program colors identical sequences </programdescription> <inputformats> <fileextension>col</fileextension> </inputformats> <outputformats> <fileext>col</fileext> </outputformats> </program>The program does not take any commandline options, so the last thing to do is to add the empty parameter tag, and then the finished XML-code will look like this: <program name="id_shade" priority="7" package="coloring tools" selected="false" sequencetype="RNA"> <programdescription> The program colors identical sequences </programdescription> <inputformats> <fileextension>col</fileextension> </inputformats> <outputformats> <fileext>col</fileext> </outputformats> <parameters/> </program>This code is then put almost at the end of the programs.xml file, just before the </programs> tag. To test if you have done it correct, start SARSE and create a new project. The project should be based on the file id_shade.fasta that is included in the tutorial-data directory. When the project is loaded, open the program window, where you now, hopefully, can see id_shade, located under the coloring tools package. If it doesn't work be sure to check the spelling of the tags. The resulting file should look like this showing in red which sequences are duplicated:
 Comments, questions, etc., email
webmaster@sarse.ku.dk. |
| Last updated November 5th, 2007 by E. S. Andersen, A. Lind-Thomsen and J. Gorodkin |